Whether you’re a single adult wondering if $450 a month on groceries is reasonable, or a family of five trying to figure out why the bill keeps climbing, the question almost always comes back to the same place: what should we actually be spending?
The problem with most answers is that they cite a national average without adjusting for household size. A number that’s typical for a family of four is completely different from what makes sense for a solo shopper or a couple. Using the wrong benchmark leads to budgets that are either unrealistically tight or quietly too generous.
This guide breaks down the realistic grocery budget for every common household size using current data from the USDA and the Bureau of Labor Statistics, so you know exactly where your spending should fall, and what to do if it doesn’t.
How the USDA Measures What Groceries Should Cost
The most authoritative benchmark for household grocery spending comes from the USDA’s Food and Nutrition Administration (FNA), which publishes a monthly Cost of Food at Home report covering four spending tiers:
Thrifty: The lowest-cost tier. Every meal must be cooked from scratch at home, store brands are the default, and food waste is essentially zero. The Thrifty plan is also the benchmark the federal government uses to set maximum SNAP (food stamp) benefit amounts.
Low-Cost: A modest step above Thrifty that allows for slightly more variety and a little less rigidity at the store.
Moderate: The most realistic tier for most middle-income families. It reflects actual shopping patterns and accommodates some convenience foods, a wider protein selection, and occasional premium items.
Liberal: The highest tier, intended for households that regularly buy organic produce, premium cuts of meat, and higher-quality prepared or specialty foods.

Two things to keep in mind as you use these numbers. First, all four plans assume every meal and snack is prepared at home. Dining out, ordering delivery, or grabbing coffee on the way to work is not included. Second, the USDA applies household size adjustments because a single person can’t buy in bulk as efficiently as a larger household and tends to waste more food. Single-person households pay about 20% more per capita than a four-person reference household. Two-person households pay about 10% more. Three-person households pay about 5% more. Households of five or six receive a 5% per-person reduction. The USDA explicitly recommends: first sum the individual costs for each household member, then apply the appropriate household size adjustment.
Note: As of June 1, 2026, the USDA’s Food and Nutrition Service (FNS) was officially renamed the Food and Nutrition Administration (FNA). All links and citations in this article reflect the current agency name and domain (fna.usda.gov).
Average Grocery Budget by Household Size: Quick Reference Table
The table below reflects USDA food plan costs for the most common household sizes, drawn from the FNA’s May 2026 Cost of Food at Home report (the most recently published data). The four-person reference family figures are taken directly from the official report. Single-adult and two-adult figures include the USDA’s mandated household size adjustments. Three, five, and six-person figures are calculated using FNA per-individual costs and the official adjustment factors.
| Household | Thrifty/mo | Low-Cost/mo | Moderate/mo | Liberal/mo |
| 1 Adult, Woman (20–50) | ~$303 | ~$330 | ~$403 | ~$513 |
| 1 Adult, Man (20–50) | ~$381 | ~$379 | ~$476 | ~$582 |
| 2 Adults | ~$626 | ~$650 | ~$806 | ~$1,004 |
| 3 People (est.) | ~$817–$851 | ~$895–$904 | ~$1,089–$1,137 | ~$1,331–$1,386 |
| 4 People | ~$1,018 | ~$1,122 | ~$1,387 | ~$1,675 |
| 5 People (est.) | ~$1,145 | ~$1,235 | ~$1,528 | ~$1,845 |
| 6 People (est.) | ~$1,309 | ~$1,400 | ~$1,724 | ~$2,084 |
Single-person costs include the USDA +20% household adjustment; two-person costs include +10%; three-person costs include +5%; five and six-person costs include a -5% adjustment. The three-person range reflects variation in the child’s age (6–8 vs. 9–11 years). Source: USDA FNA Cost of Food at Home Monthly Reports, May 2026.
Average Grocery Budget for 1 Person

Single adults pay more per person than any other household type. Bulk buying is inefficient for one person, food tends to go to waste more easily, and package sizes are often priced for larger households. The FNA accounts for this with a mandatory 20% upward adjustment applied after summing individual costs.
For a single adult between 20 and 50 years old, the FNA’s May 2026 data puts individual monthly food costs at $252.40 for women and $317.10 for men on the Thrifty plan, before the household adjustment. With the 20% single-person premium applied:
Single adult woman (20–50):
- Thrifty: ~$303/month (~$70/week)
- Low-Cost: ~$330/month (~$76/week)
- Moderate: ~$403/month (~$93/week)
- Liberal: ~$513/month (~$118/week)
Single adult man (20–50):
- Thrifty: ~$381/month (~$88/week)
- Low-Cost: ~$379/month (~$87/week)
- Moderate: ~$476/month (~$110/week)
- Liberal: ~$582/month (~$134/week)
The gap between male and female figures reflects average calorie requirements, not lifestyle differences. Note that for men, the Thrifty and Low-Cost totals land very close together because the two plans use different underlying market baskets (the Thrifty plan was updated in 2021 while the Low-Cost plan uses a 2007 methodology), and those baskets have tracked at similar price levels for the male 20–50 age group.
Most single adults who cook several nights a week but also buy some convenience items end up between the Low-Cost and Moderate tiers, roughly $330 to $476 per month for women and $379 to $476 per month for men. If you’re consistently spending $580 or more on groceries alone as a single person, you’re in Liberal territory, which typically means a lot of organic food, specialty proteins, premium convenience items, or frequent grocery store wine purchases.
For adults over 51, calorie needs decrease modestly, so FNA estimates are slightly lower for that age group.
Takeaway: A reasonable grocery budget for one person falls between $303 (Thrifty, woman) and $476 (Moderate, man). Most single adults who cook regularly land around $330 to $440 per month.
Average Grocery Budget for 2 People

Two-person households get a small per-capita discount compared to solo shoppers. The USDA applies a +10% adjustment, which reflects better opportunities for shared bulk buying and slightly less per-person waste.
For one adult man and one adult woman, both ages 20–50, the May 2026 FNA benchmarks work out to:
| Budget Tier | Monthly | Weekly |
| Thrifty | ~$626 | ~$145 |
| Low-Cost | ~$650 | ~$150 |
| Moderate | ~$806 | ~$186 |
| Liberal | ~$1,004 | ~$232 |
Most couples who cook at home regularly fall between Thrifty and Moderate. A monthly grocery budget of $700 to $850 for two adults is very achievable at a mainstream grocery store buying a reasonable mix of proteins, produce, and pantry staples.
If your two-person grocery bill is consistently pushing toward $1,000 or more, check whether you’re including household supplies (cleaning products, paper goods, personal care) in the grocery spend. These items can easily add $100 to $200 per month to what looks like a food bill.
Takeaway: Most two-person households should budget $626 to $806 per month on groceries, depending on how much flexibility they want and how often they cook from scratch.
Average Grocery Budget for a Family of 3

The USDA doesn’t publish a dedicated reference family for three-person households, so exact figures require summing individual costs and then applying the +5% three-person adjustment. The most important variable here is the age of the third person.
A toddler adds far less to a grocery bill than a 16-year-old, who can easily eat as much as an adult. A family of three with a child under five will spend noticeably less than a family of three with a hungry high schooler.
For two adults and a school-age child (ages 6–11):
- Thrifty: roughly $817 to $851/month (range reflects child’s age)
- Low-Cost: roughly $895 to $904/month
- Moderate: roughly $1,089 to $1,137/month
- Liberal: roughly $1,331 to $1,386/month
If there’s a teenager in a three-person household, push toward the upper end of each range or slightly beyond. Teen boys in particular eat closer to the adult male allocation than the child allocation on all USDA plans.
Takeaway: Three-person households generally spend $820 to $1,140 per month, with the exact amount depending heavily on the child’s age and appetite.
Average Grocery Budget for a Family of 4

This is the most-searched household size and happens to be the USDA’s reference family for its food plans: two adults ages 20–50 and two children ages 6–8 and 9–11. The data here is the most precise, published directly in the official report without estimation.
Based on the FNA’s May 2026 Cost of Food at Home report, a four-person family should expect:
| Budget Tier | Weekly | Monthly |
| Thrifty | ~$235 | ~$1,018 |
| Low-Cost | ~$259 | ~$1,122 |
| Moderate | ~$320 | ~$1,387 |
| Liberal | ~$387 | ~$1,675 |
The Moderate-tier benchmark of $1,387/month is the most realistic target for most four-person households once you account for a diet with some protein variety, occasional convenience items, and the odd specialty purchase.
If your family of four spends around $1,050 to $1,250 per month and eats home-cooked meals most nights, that represents a well-managed budget sitting between Thrifty and Moderate. For a practical breakdown of how to allocate that amount across food categories each month, the monthly grocery plan for a family of four walks through it in detail.
Takeaway: A realistic family-of-four grocery budget in 2026 falls between $1,018 (Thrifty, cooking from scratch) and $1,387 (Moderate), with most families landing somewhere in the $1,100 to $1,300 range.
Average Grocery Budget for Families of 5 or More
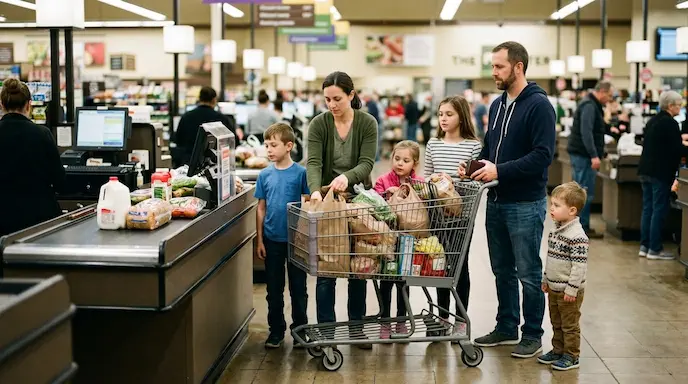
Larger households get a small per-person price break. The USDA reduces per-capita costs by about 5% for households of five or six, reflecting the real savings from cooking in larger quantities and buying in bulk more effectively. For seven or more members, the reduction is 10%.
For a family of five (two adults and three school-age children):
- Thrifty: roughly $1,145/month
- Low-Cost: roughly $1,235/month
- Moderate: roughly $1,528/month
- Liberal: roughly $1,845/month
For a family of six (two adults and four children), add roughly $160 to $240 per month across most tiers, with the exact amount depending on the ages of the children. Teenagers consistently push costs higher. Two teenagers eat nearly as much as two additional adults.
One genuine advantage for larger households is that bulk buying becomes much more practical. A warehouse club membership pays for itself quickly at this household size in a way it simply doesn’t for a couple or single adult. A well-stocked freezer also becomes a meaningful tool, not just a convenience.
Takeaway: A family of five should budget roughly $1,145 to $1,528 per month depending on tier. Add approximately $160 to $240 per additional person, adjusted upward if teens are part of the household.
What the National Average Actually Tells You
The BLS Consumer Expenditure Survey (2024 data, released December 2025) found that the average American household spends $6,224 per year on food at home, or about $519 per month. Total food spending, including restaurants and delivery, averaged $10,169 per year ($847 per month).

That sounds precise until you realize it averages together single adults in studio apartments and families of six in suburban houses. A figure that’s simultaneously average for both isn’t particularly useful for either.
What the national average is good for: a rough gut check on whether your spending is wildly different from the broader population, and a way to measure how your own spending has changed over time.
What it can’t tell you: whether your spending is appropriate for your household size and lifestyle. The USDA data organized by household size does that much better.
One important reality check from the BLS figures: if you’re a family of four spending right at the $519 national household average for food at home, you’re spending well below even the USDA Thrifty plan for your household size. That almost always means some combination of eating out frequently, tracking grocery spending incompletely, or genuinely cutting back on produce and protein.
What Percentage of Income Should Go to Groceries?
Most financial planners recommend spending 10 to 15% of your after-tax income on all food-related expenses combined, groceries, dining out, and delivery. For groceries specifically, many advisors suggest targeting 6 to 10% of take-home pay.
Here’s what that range looks like across different income levels:
| Monthly Take-Home | 10% Food Budget | 15% Food Budget |
| $2,500 | $250 | $375 |
| $3,500 | $350 | $525 |
| $4,500 | $450 | $675 |
| $6,000 | $600 | $900 |
| $8,000 | $800 | $1,200 |
This guidance fits within the 50/30/20 rule, where food falls under the 50% needs category alongside rent, utilities, and transportation.

The percentage approach has one real limitation: it doesn’t account for household size. A couple taking home $4,500 per month and spending $450 on groceries (10%) is in reasonable shape. A family of five earning the same $4,500 and spending $450 is well below the Thrifty plan for their household size. The percentage tells you something about financial balance but nothing about nutritional adequacy.
Use 10 to 15% as a loose ceiling on total food spending. If you’re consistently over 15% on groceries alone, that’s worth examining. If you’re at 10% with a large family, make sure you’re not cutting nutrition to hit a number.
For a more complete framework on building your household food budget from scratch, the complete guide to budgeting your groceries covers the full process.
Factors That Push Your Grocery Bill Higher or Lower
Two households of the same size can have grocery budgets that vary by several hundred dollars per month. These are the biggest variables:
Where you live. Grocery costs vary meaningfully by state and city. Urban areas, especially on the coasts, tend to run 15 to 30% above the national average. Midwestern and Southern cities are generally more affordable. Hawaii is a significant outlier: the FNA’s May 2026 report puts the Thrifty plan for the reference family of four at $1,566.50/month in Hawaii, compared to $1,018.20 on the mainland, a premium of roughly 54%.
What you eat. Diet composition matters as much as quantity. A household that eats beef several nights a week is absorbing significant price pressure in 2026 specifically, with beef prices running sharply above historical averages. Organic produce, specialty diets (gluten-free, keto, plant-based with specialty proteins), and premium cuts push budgets higher. A mostly plant-based diet with legumes and seasonal produce can land well below the Thrifty benchmark.
Where you shop. Store choice is one of the most direct levers available. Households that primarily shop at discount grocers typically spend 15 to 25% less than those shopping at conventional chains for an equivalent basket of food.
How much you actually cook. Every restaurant meal, delivery order, or fast-food run is additional food spending, even when it doesn’t appear on the grocery receipt. The USDA benchmarks are built on the assumption that zero meals come from restaurants. If you eat out twice a week, your total food spending will be considerably above these figures.
Food waste. Wasted food is the silent budget drain that most households don’t track. Buying ingredients that spoil before use, overbuying perishables, and cooking more than gets eaten all inflate the effective cost of food without adding any nutritional value to the household.
2026 Grocery Prices: What’s Rising and What’s Falling
Grocery inflation has moderated significantly since 2022 but hasn’t stopped. According to the USDA Economic Research Service (Food Price Outlook, updated July 24, 2026), food-at-home prices rose 2.3% in 2025 and are forecast to increase 2.7% in 2026.
Within that overall figure, specific categories are moving very differently:
Rising faster than the overall average in 2026:
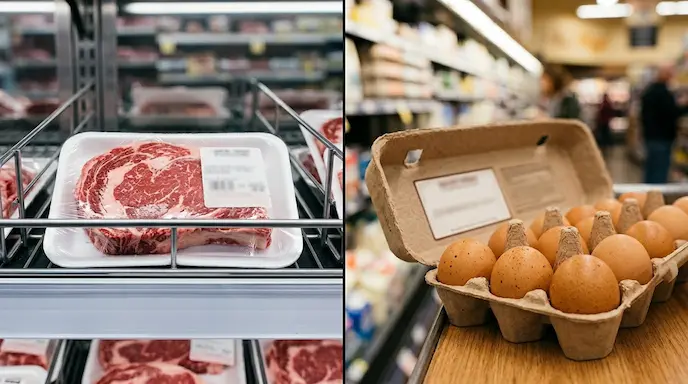
- Beef and veal: +10.7% — The U.S. cattle herd has shrunk to its lowest level in 75 years. Tight supply with sustained consumer demand has pushed retail beef prices well above historical norms. Wholesale beef prices were 12.7% higher in June 2026 than a year earlier.
- Sugar and sweets: +7.2% — Primarily driven by candy and confectionery prices, including chocolate.
- Fresh vegetables: +6.8% — With significant variation by item: lettuce prices were up 32.1% and tomatoes up 19.5% year-over-year through June 2026.
- Nonalcoholic beverages: +3.9% — Partially tied to elevated coffee and tea prices from supply disruptions in major producing regions.
Falling in 2026:
- Eggs: -30.7% — After dramatic spikes in 2024 and 2025 caused by avian influenza outbreaks, egg production has recovered and prices have reversed sharply. Retail egg prices were 27.9% lower in June 2026 than in June 2025, averaging $2.14 per dozen.
What this means for your budget: If beef is a regular part of your weekly meals, you’re absorbing real pressure right now. Swapping some red meat for chicken ($4.18/lb on average in June 2026, with only 1.0% forecast inflation for the year) or pork (forecast +1.6%) is one of the most direct ways to offset the current price environment. Eggs, at $2.14 per dozen, are among the best value buys in the grocery store right now.
For specific strategies on managing your grocery spending as food prices shift, the guide on cutting your grocery bill as food prices rise covers the most effective approaches.
How to Set Your Grocery Budget Using These Numbers
The benchmarks above are useful only if you apply them. Here’s a straightforward three-step process:

Step 1: Find your USDA baseline. Locate your household size in the table and choose the tier that best reflects your life. Thrifty if you cook almost everything from scratch and rarely have food go to waste. Moderate if you want flexibility, more protein variety, and the occasional convenience item. That number becomes your monthly target.
Step 2: Adjust for your reality. If you live in a high-cost urban area, add 15 to 25%. If your household has dietary restrictions requiring specialty ingredients, account for those. If you shop primarily at discount grocers, you may be able to reach or beat the Thrifty-tier cost while eating at a Moderate-tier quality level. If you live in Hawaii, the official FNA adjustment runs approximately 54% above mainland levels.
Step 3: Track actual spending for a full month. Most grocery store loyalty programs and credit card apps do this automatically. Compare your real number against your household benchmark. The gap, if there is one, shows you exactly what you’re working with.
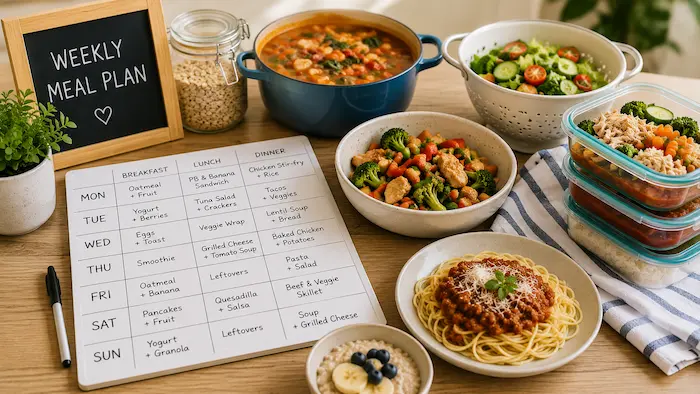
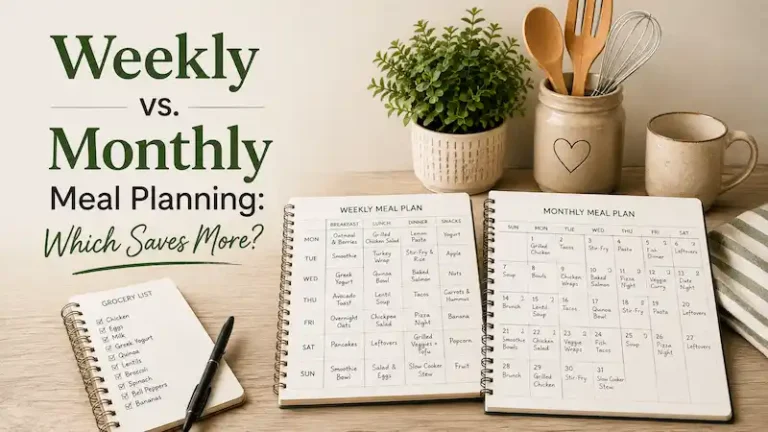
If you haven’t tried meal planning as a way to reduce spending, the guide on planning and budgeting groceries for the week offers a practical starting framework that fits any household size. And for specific, actionable ways to reduce your total spend, the 25 tips that actually save money on groceries covers what makes a real difference.
Is Your Grocery Budget on Track? A Quick Check
You may be spending below your household’s appropriate range if:
- You’re a family of four spending under $1,018/month while eating home-cooked meals most nights
- You regularly skip produce or lean proteins to stay under a number
- You frequently run low on essentials before the next shopping trip
You likely have room to cut if:
- You’re a couple spending $1,100 or more per month at the grocery store while rarely eating out
- You’re a single adult spending more than $580 monthly on groceries alone
- You throw away a significant amount of food most weeks without a clear reason
The goal isn’t to hit a precise number. It’s to understand what a reasonable benchmark looks like for your specific household and make informed decisions from there.
What This Means for Your Household
Your grocery budget has no single universal right answer. But thanks to decades of USDA data collection, it’s not a mystery either. Every household size has a well-researched benchmark range, adjusted for the realities of bulk buying, food waste, and calorie needs.
Start with the table in this article. Find your household size and choose the tier that reflects how you actually shop and cook. Compare that figure to what you’re currently spending. Then, if there’s a gap worth closing, you have a clear starting point.
That process, find your benchmark, check your real number, identify the gap, is more actionable than any percentage rule or national average.